
Cycling, the new COVID-19 side effect?
I've been reading a bit about the increased number of people cycling
while the world is in lockdown but last week there were a few articles
about the bicycle numbers in Melbourne that I was a little dubious
about. So I did what no sane person does, I dived into the data...
The article (Car parks out, footpaths and cycling lanes in as city prepares for post-COVID commuters) in The Age on 7th May 2020 cited cycling growth figures of 138% to 778% which seemed a little high to be believable. The figures apparently came from an article and report by the Bicycle Network detailing changes in cycling activity based on surveys they had conducted. Now firstly, I couldn't find matching figures in the report for all the sites listed in The Age article, but more importantly I had a few issues with the data being used for this kind of analysis.
Bicycle network published the data from 4 surveys, one on Sunday 10th of November 2019 and three in April 2020 on a Wednesday, a Tuesday and a Saturday, each of which were conducted for two hours. For most traffic in Melbourne (including cycling traffic I have analysed previously) weekdays have substantially different traffic patterns to weekends, so the only survey that could really be compared to November 2019 was the Saturday survey on the 25th of April 2020. However comparing these two days still raises some flags, for a start they are still different days of the week, but also, the 25th of April is ANZAC day!
So in summary the results in The Age article came from 2 hours of data, at 4 sites, on different days of the week, with one day being a public holiday.
In this article I have examined an alternate dataset, the VicRoads/Department of Transport (DOT) bicycle counters, to see if the Bicycle Network survey days are representative of a general trend and attempt to provide a more robust result by increasing the sample size.
But first, lets look at the sites. On the map below the blue markers are four Bicycle Network survey locations and the circles are the DOT bicycle counters. The red circles are the site selected for comparison and the green circles are the remaining sites in the bicycle counter network.
The data collection points don't overlap exactly however three bicycle counter sites were selected quite close to two of the the Bicycle Network locations and one other DOT site was include to help understand the spread of the data (and have at lest one site west of the CBD).
The first thing I like to do in an analysis is to try and get a look at the whole data and see if anything stands out as being unusual, it is the first reality check in the process. Below is a month of data from the four selected sites displayed as a daily count with the Bicycle Network survey dates marked in red. The first thing that I notice is that for most sites the 10th November 2019 had a below average count and the 25th April 2020 had an above average count relative to the rest of the month.
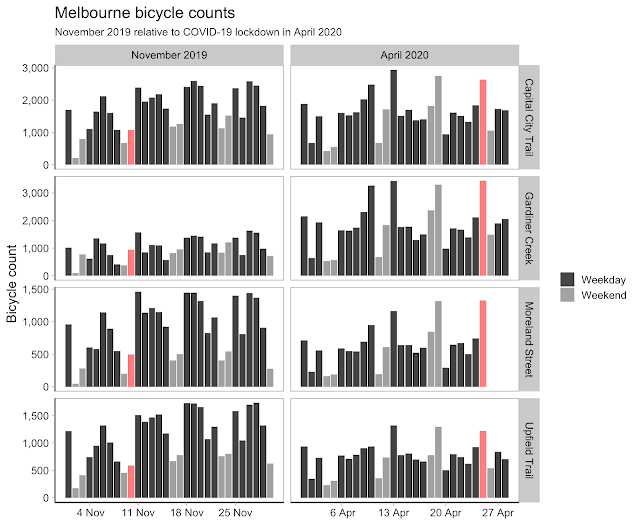
A quick look at the Bureau of Meteorology for November and April shows that the 10th November had a little rain and not much sunshine, while 25th April was a (slightly) warmer, beautiful sunny day with no rain. This may account of some of the difference however the pattern for April is somewhat erratic.
It is also worth noting that both months contain public holidays so are not ideal for investigating trends but aggregating over the whole month provides some level of smoothing. Grouping by weekdays and weekends shows that in most cases weekday traffic was higher in November and weekend traffic was higher in April but by a lower margin than claimed in The Age article.
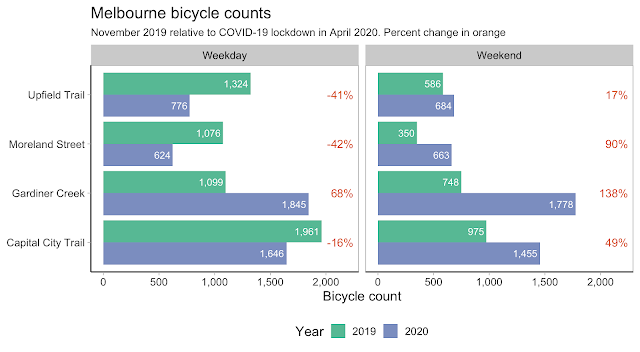
In summary, on week days there was a decease in cyclist number at 3 of the 4 sites, which makes sense with less people commuting to work, and an increase at all 4 sites on the weekends of between 17% and 138%. Gardiners Creek in particular seems to have the most dramatic increase and was the only site to have an increase in weekday traffic.
While this analysis is not perfect, I do believe it gives a better representation of what is actually happening on the bike paths around Melbourne. To improve it we could include more sites as well as use a longer time period as a baseline and consider removing public holidays. In addition the distribution of traffic across the day could provide insight into the source of the difference, i.e. a shift from commuting to recreational cycling.
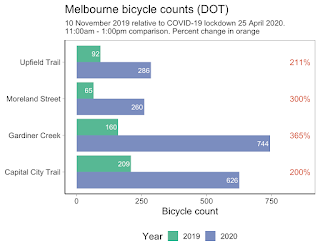
For fun we can also try and replicate the results in Bicycle Network report by restricting the data to the same time period. Note: that I do not believe the below results are representative of actual cyclist growth.
While the results are a little different to The Age article (294% for Gardiners Creek Trail and 221% Capital City Trail respectively), they are in the same ball park. This shows that the data is not necessarily wrong, just that the results are heavily influenced by the way (or the time) sample was collected, i.e. sampling bias, and probably shouldn't be used to forecast cycling growth.
Now don't get me wrong, I am all for improving cycling infrastructure, particularly being a commuter cyclist, but lets provide the best data (and sampling methods) available to inform decisions.
Sources:
The article (Car parks out, footpaths and cycling lanes in as city prepares for post-COVID commuters) in The Age on 7th May 2020 cited cycling growth figures of 138% to 778% which seemed a little high to be believable. The figures apparently came from an article and report by the Bicycle Network detailing changes in cycling activity based on surveys they had conducted. Now firstly, I couldn't find matching figures in the report for all the sites listed in The Age article, but more importantly I had a few issues with the data being used for this kind of analysis.
Bicycle network published the data from 4 surveys, one on Sunday 10th of November 2019 and three in April 2020 on a Wednesday, a Tuesday and a Saturday, each of which were conducted for two hours. For most traffic in Melbourne (including cycling traffic I have analysed previously) weekdays have substantially different traffic patterns to weekends, so the only survey that could really be compared to November 2019 was the Saturday survey on the 25th of April 2020. However comparing these two days still raises some flags, for a start they are still different days of the week, but also, the 25th of April is ANZAC day!
So in summary the results in The Age article came from 2 hours of data, at 4 sites, on different days of the week, with one day being a public holiday.
In this article I have examined an alternate dataset, the VicRoads/Department of Transport (DOT) bicycle counters, to see if the Bicycle Network survey days are representative of a general trend and attempt to provide a more robust result by increasing the sample size.
But first, lets look at the sites. On the map below the blue markers are four Bicycle Network survey locations and the circles are the DOT bicycle counters. The red circles are the site selected for comparison and the green circles are the remaining sites in the bicycle counter network.
The data collection points don't overlap exactly however three bicycle counter sites were selected quite close to two of the the Bicycle Network locations and one other DOT site was include to help understand the spread of the data (and have at lest one site west of the CBD).
 |
| Bicycle counter and survey locations |
The first thing I like to do in an analysis is to try and get a look at the whole data and see if anything stands out as being unusual, it is the first reality check in the process. Below is a month of data from the four selected sites displayed as a daily count with the Bicycle Network survey dates marked in red. The first thing that I notice is that for most sites the 10th November 2019 had a below average count and the 25th April 2020 had an above average count relative to the rest of the month.

A quick look at the Bureau of Meteorology for November and April shows that the 10th November had a little rain and not much sunshine, while 25th April was a (slightly) warmer, beautiful sunny day with no rain. This may account of some of the difference however the pattern for April is somewhat erratic.
It is also worth noting that both months contain public holidays so are not ideal for investigating trends but aggregating over the whole month provides some level of smoothing. Grouping by weekdays and weekends shows that in most cases weekday traffic was higher in November and weekend traffic was higher in April but by a lower margin than claimed in The Age article.

In summary, on week days there was a decease in cyclist number at 3 of the 4 sites, which makes sense with less people commuting to work, and an increase at all 4 sites on the weekends of between 17% and 138%. Gardiners Creek in particular seems to have the most dramatic increase and was the only site to have an increase in weekday traffic.
While this analysis is not perfect, I do believe it gives a better representation of what is actually happening on the bike paths around Melbourne. To improve it we could include more sites as well as use a longer time period as a baseline and consider removing public holidays. In addition the distribution of traffic across the day could provide insight into the source of the difference, i.e. a shift from commuting to recreational cycling.

For fun we can also try and replicate the results in Bicycle Network report by restricting the data to the same time period. Note: that I do not believe the below results are representative of actual cyclist growth.
While the results are a little different to The Age article (294% for Gardiners Creek Trail and 221% Capital City Trail respectively), they are in the same ball park. This shows that the data is not necessarily wrong, just that the results are heavily influenced by the way (or the time) sample was collected, i.e. sampling bias, and probably shouldn't be used to forecast cycling growth.
Now don't get me wrong, I am all for improving cycling infrastructure, particularly being a commuter cyclist, but lets provide the best data (and sampling methods) available to inform decisions.
Sources:
- VicRoads / Department of Transport - Bicycle volume and speed data
- Bicycle Network - More people out on bicycles: Recreational activity surveys during COVID-19 and comparison with pre-lockdown activity levels


Comments
Post a Comment